

-
A-Line
А-Line 32D software, developed for acoustic emission systems of various modifications and systems of CDM, is implemented in Windows environment, is based on general verified principles of hardware and dataflows command, is uniform in style regarding visual representation of graphic and text information and methods of set-up, is supplied with a detailed user's guide and is easily learnt.
Simple and convenient well known user-friendly interface in Russian fully realizes the ample opportunities of AE complexes and CDM systems on measurement, processing and representation of the results of testing both on-line and in the mode of the subsequent in-depth analysis the received data (postprocessing).
Interface
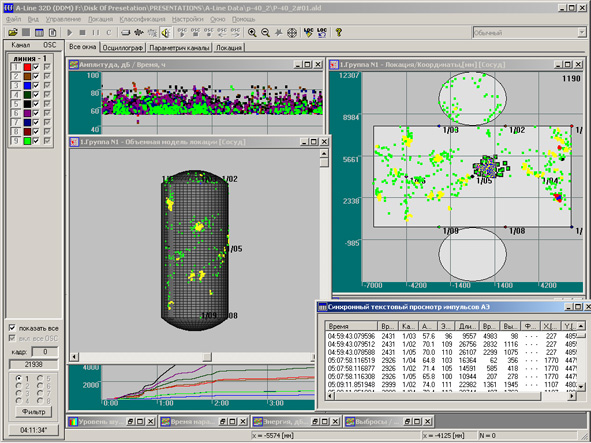
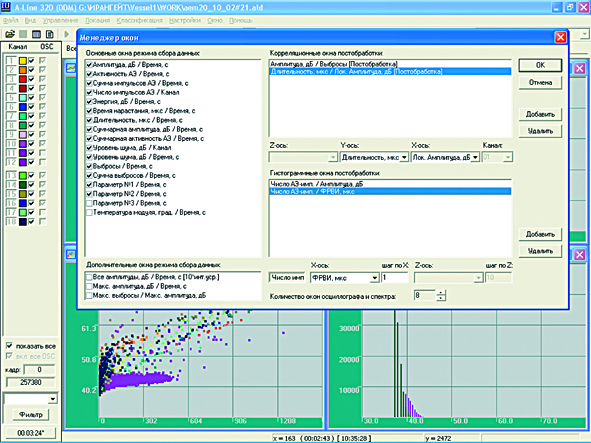
- The usual multiwindow and multipage interface for graphic and text representation of the data received in the course of data acquisition and in postprocessing is easily and independently set-up by the operator proceeding from peculiarities of a personal perception of information and the chosen methodical aspects of analysis.
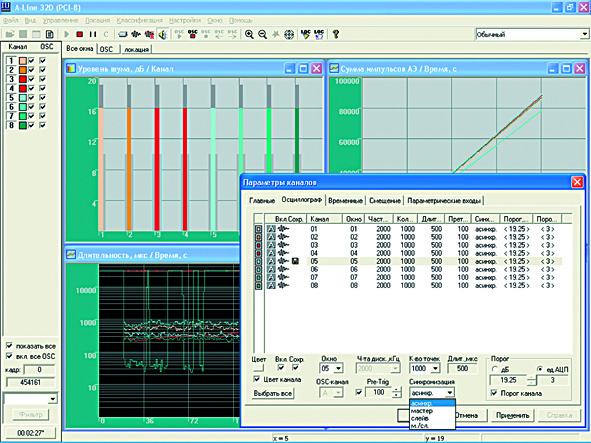
- The convenient control menu for setting up the parameters of graphic and text display: forms of data output, color palette, automatic or fixed axes scaling, automatic scrolling of visibility scope, linear or logarithmic type of schedules and coordinate grid, increase mode, etc., satisfies any various users’ preferences regarding data representation.
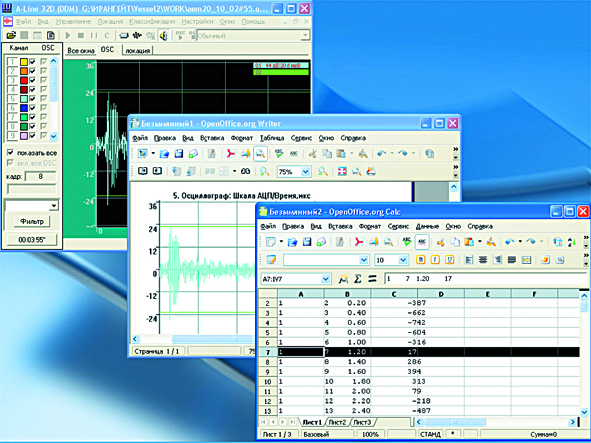
- Compatibility of text and graphic data representation with other Windows applications makes data transfer to other information environments for carrying out of their individual extra analysis easy and accessible.
- Simplicity of set-up and control of the system alongside with ample opportunities of change of operation modes and characteristics of the complex is provided by application of modern elements of Windows control.
- At the client’s option the software interface can be translated into any language. English and Russian versions are currently available.
Perfomance capabilities
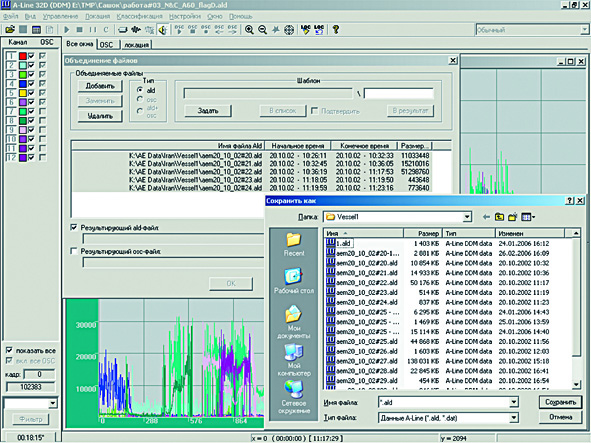
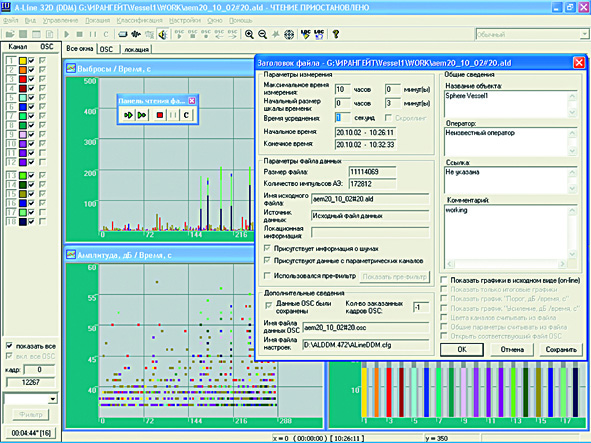
- All the data received in the course of the complex operation: AE data, readings of the sensors connected to parametric channels, characteristics of the condition and settings of the hardware component, the operator’s command and actions are automatically saved in specialized files of binary format, reading which it is possible not only to completely restore the testing resultant pattern, but also to repeat in detail all the process of data acquisition on a second-to-second basis. The received files can be divided into separate parts or vice versa to unite several parts in a unified whole as well as restore them in case of possible damage, for instance, as a result of power failure in the central block of data acquisition and processing.
- Settings of the hardware and software parts of the complex can be changed by the operator directly in the course of working as there is no need to stop of the process of measurements or restart the complex and can be saved in a separate file of configuration for convenience of further use. Thus, it is preferable to create in advance several various copies of settings, the so-called "instrumentation profiles", so as in the process of data acquisition to on-the-fly react to changes of the emission process character or other factors with the choice of the appropriate profile. Besides, to facilitate the subsequent data analysis, the operator can fix any events on-line which took place during the inspection by means of time markers supplied with text comments.
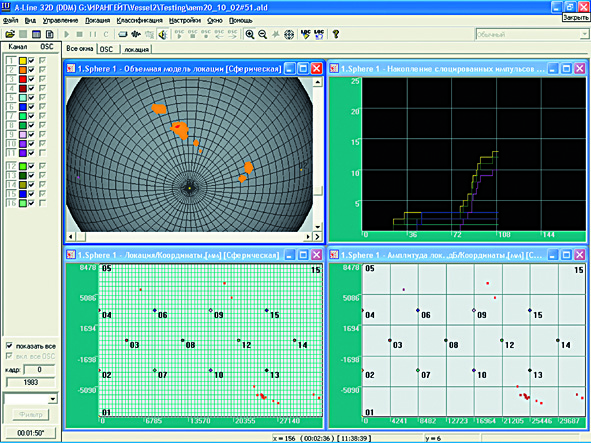
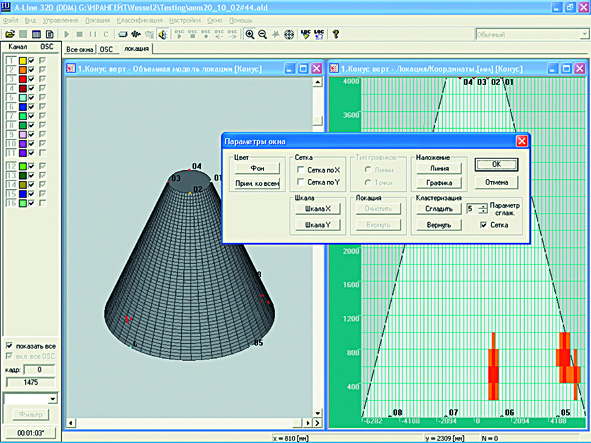
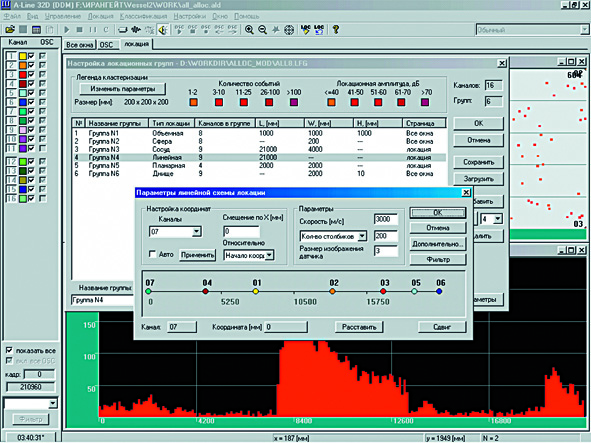
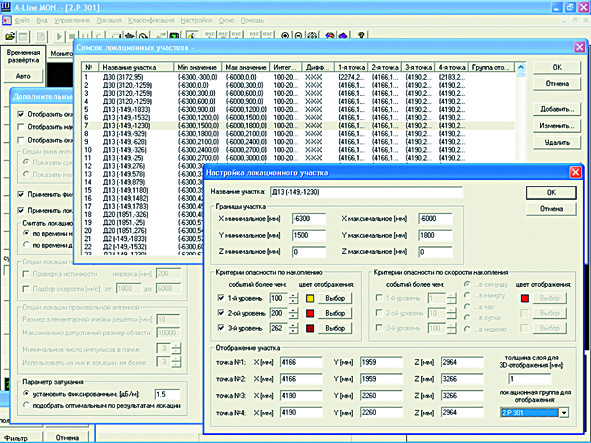
- Various locations of AE sources: linear and planar, zone and 3-dimentional (3D), on the surface of cylindrical, conic and spherical vessels, tank bottoms and walls allow to calculate the defects coordinates for object of any dimensions. Simultaneous formation and use of any number of various location groups is available, the same channel in various location groups can also be simultaneously used.
- A wide variety of classical methods of coordinates calculation implemented in software: AE arrival or maximum amplitude time difference, triangular (via three AE channels),
rectangular (via four AE channels) with adjustable velocity or arbitrary (via the whole set of AE impulses registered during a characteristic time interval), etc., provides ample opportunities of location analysis of the data acquired.
- Developed by the company employees, a new revolutionary method of the fuzzy location by freeform antenna, in turn has a number of essential advantages over classical procedures of location: it does not impose restrictions on sensors arrangement, is less sensitive to accuracy in impulse arrival time evaluation, accuracy of the assignment of AE impulses distribution velocity and anisotropy of the object material, etc.
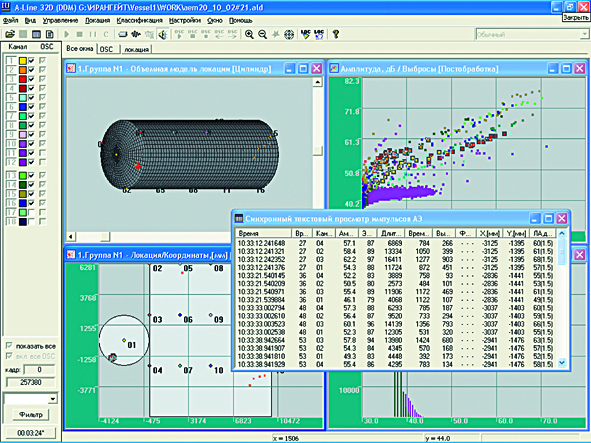
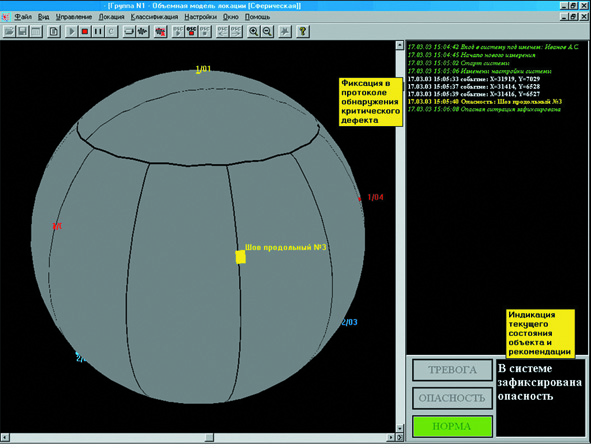
- Graphic representation of the location results is implemented in the form of their overlay on maps and 3D models of the tested objects. Besides, to additionally illustrate the site of the revealed sources we overlay a graphic mask, representing a joints map or features of the composite construction of 2D or 3D object, on location windows.
- Application of flexible criteria of automatic rejection of false AE sources caused by electromagnetic noise, interference of different sort and re-reflections of signals, both in data acquisition mode and postprocessing considerably raises reliability of testing. Besides, use of “a parametrical strobe" is available, and namely, the opportunity to remove or keep only those events which in time coincided with the certain set value of the measured external parameter, for instance, the object load.
- Proceeding from the given model of waves attenuation in the object material, alongside with coordinates of AE sources, a location amplitudes map (impulse amplitudes at the radiation point) is calculated and displayed in a special window and is an important initial parameter for danger level evaluation of the revealed sources in terms of amplitude criterion and additional factor for the analysis of physical reliability of the results.
- According to the dynamics of accumulation of the located events, separately noted for each location group, conclusions are drawn on the current danger level of the revealed AE sources in terms of local dynamic criterion and decision making on expediency of the further object load in the course of testing.
- Location object clusterization (segmentation) can be carried out both on the number of located events and on the AE sources calculated amplitude which makes demonstrative the danger level in terms of concentration criterion and allows to evaluate the size of radiation region. The cluster location picture can be smoothed for elimination of casual and weak AE sources from the subsequent consideration.
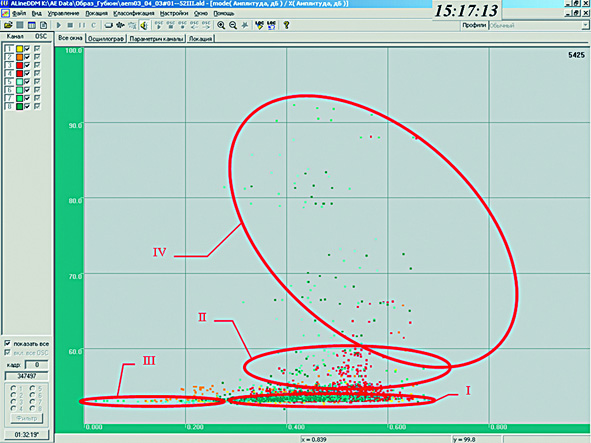
- Alongside with classical methods of classification of AE sources by danger level executed according to PB 03-593-03: the amplitude, local dynamic and integrated ones, a new statistical criterion for differentiation of AE sources has been developed in our software in cooperation with the company experts. Its application, unlike other criteria, does not require preliminary data filtration.
- In the event that characteristics of acoustic waves distribution in the material of the tested object are unknown in advance, they can be evaluated using the built-in utility for AE impulses velocity and attenuation measurement in the environment.
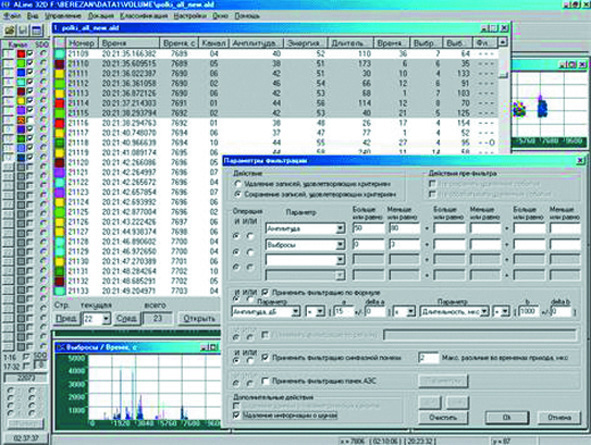
- Ample opportunities for experimental data filtration: by any AE parameter and their combinations, by results of location and clusterization, by any highlightened graphic area on any diagram and functional formula connecting various characteristics of AE impulses as well as connecting them with external parameters, on removal of common-mode interference and leakage signals, etc. allow to apply the most complex methodical recommendations for useful signals extraction from the main stream of information. The applied sets of filters can be saved in separate specialized files and loaded for newly-received data analysis.
- Often we find it very useful to apply a special class of filters loaded before the commencement of measurements directly in the hardware of the complex, the so-called prefilters. In this case extraction of characteristic AE impulses occurs on-line in the computer part of the hardware and, hence, only an obviously useful signals are exposed to the program analysis and display, which considerably facilitates perception of the information and often allows to draw conclusions about the object state on-the-fly. That, alongside with the mode of automatically adjustable threshold, is a key moment for organization of a continuous monitoring and analysis in CDM systems.
- The use of audio alarm is an important element of diagnostics security and a means of additional indication of its certain stages and events. For this purpose, in the course of set up various probable events in the system, ranges of AE parameters registration, location coordinates, external parameters values, etc. are assigned to this or that wave file which is played at the moment of fulfillment of the specified conditions, attracting additional attention of the complex operators and the staff of the tested object.
- The software opportunities are best fulfilled in postprocessing. In this mode all the measured and calculated AE impulses parameters can be shown related to one another, to time, location coordinates and parametric channels data, as well as to histograms of distribution of signals number to AE parameters and emission flow properties. Plus quickview of characteristics of the impulses extracted in one window in text and oscillographic mode is available as well as their parallel extraction on other diagrams including location windows.
- The opportunity of copying any graphic and text information from the software to Windows clipboard with the subsequent insert into windows-documents of popular text and graphics editors, alongside with wide internal opportunities of printing charts in the type and color at the user’s option make the process of report generation by the AE testing results easy and convenient.
- Export of all kinds of data and contents of any graphic diagram to text format enables to use our clients’ own various algorithms for data processing in specialized software of statistical and mathematical analysis.
-
A-Line OSC
Features of A-Line OSC, the specialized software for acoustic emission wave forms processing
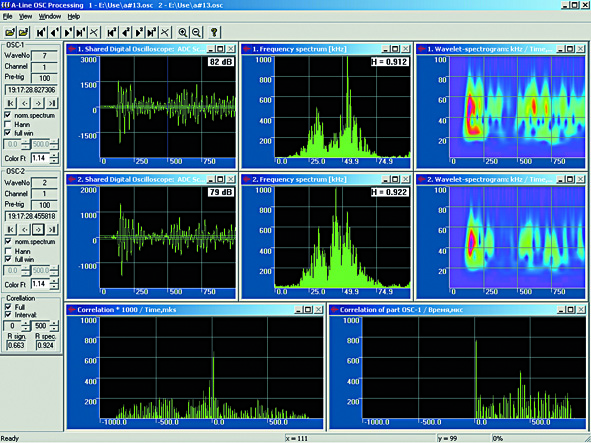
- The opportunity of convenient joint comparative analysis of two AE impulses wave forms registered by two different channels or one and the same channel, but at different time, is provided by a special pair window interface
- AE signals spectrum analysis based on fast Fourier transformation allows to make the analysis of frequency components of both a whole AE signal and its parts. It makes the program suitable not only for studying the emission nature in the course of the object testing, but also for laboratory research. Averaging of the chosen spectrum range is stipulated to ensure statistical reliability of the results.
- The presented correlation processing of AE signals waveforms and their spectra allowing to identify emission acts registered by different sensors from one source is an important element of the pattern recognition system.
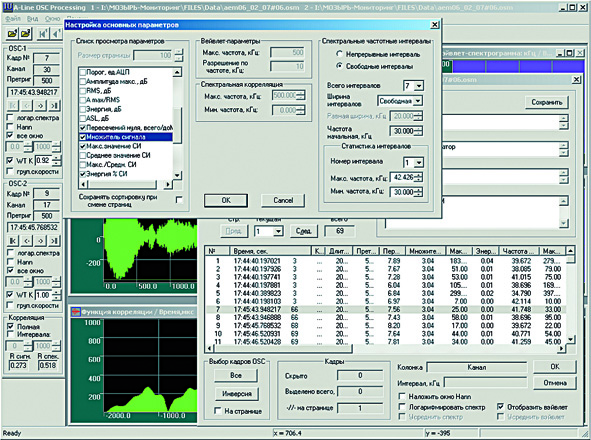
- Statistical processing of both signals and set spectral frequency intervals enables carrying out of the statistical analysis under the set characteristics of the signals form and the spectrum frequency areas. Besides, calculation of partial power characteristics is available for each interval.
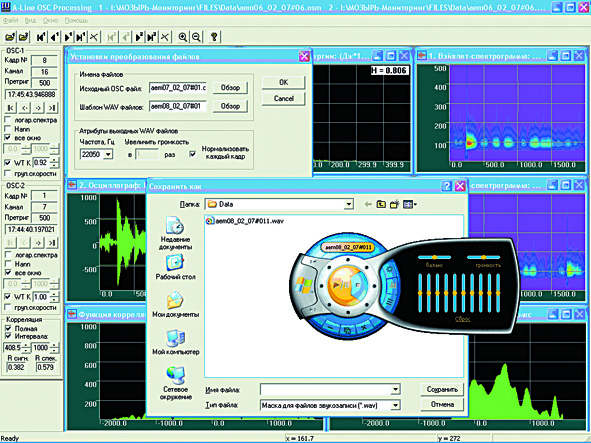
- Transformation of AE signals oscillograms into Windows sound files with various sampling rates gives the unique opportunity "to hear" emission.
- Calculation of wavelet-spectrograms of waveforms represents a powerful modern method of the time-and-frequency analysis of the AE data received.
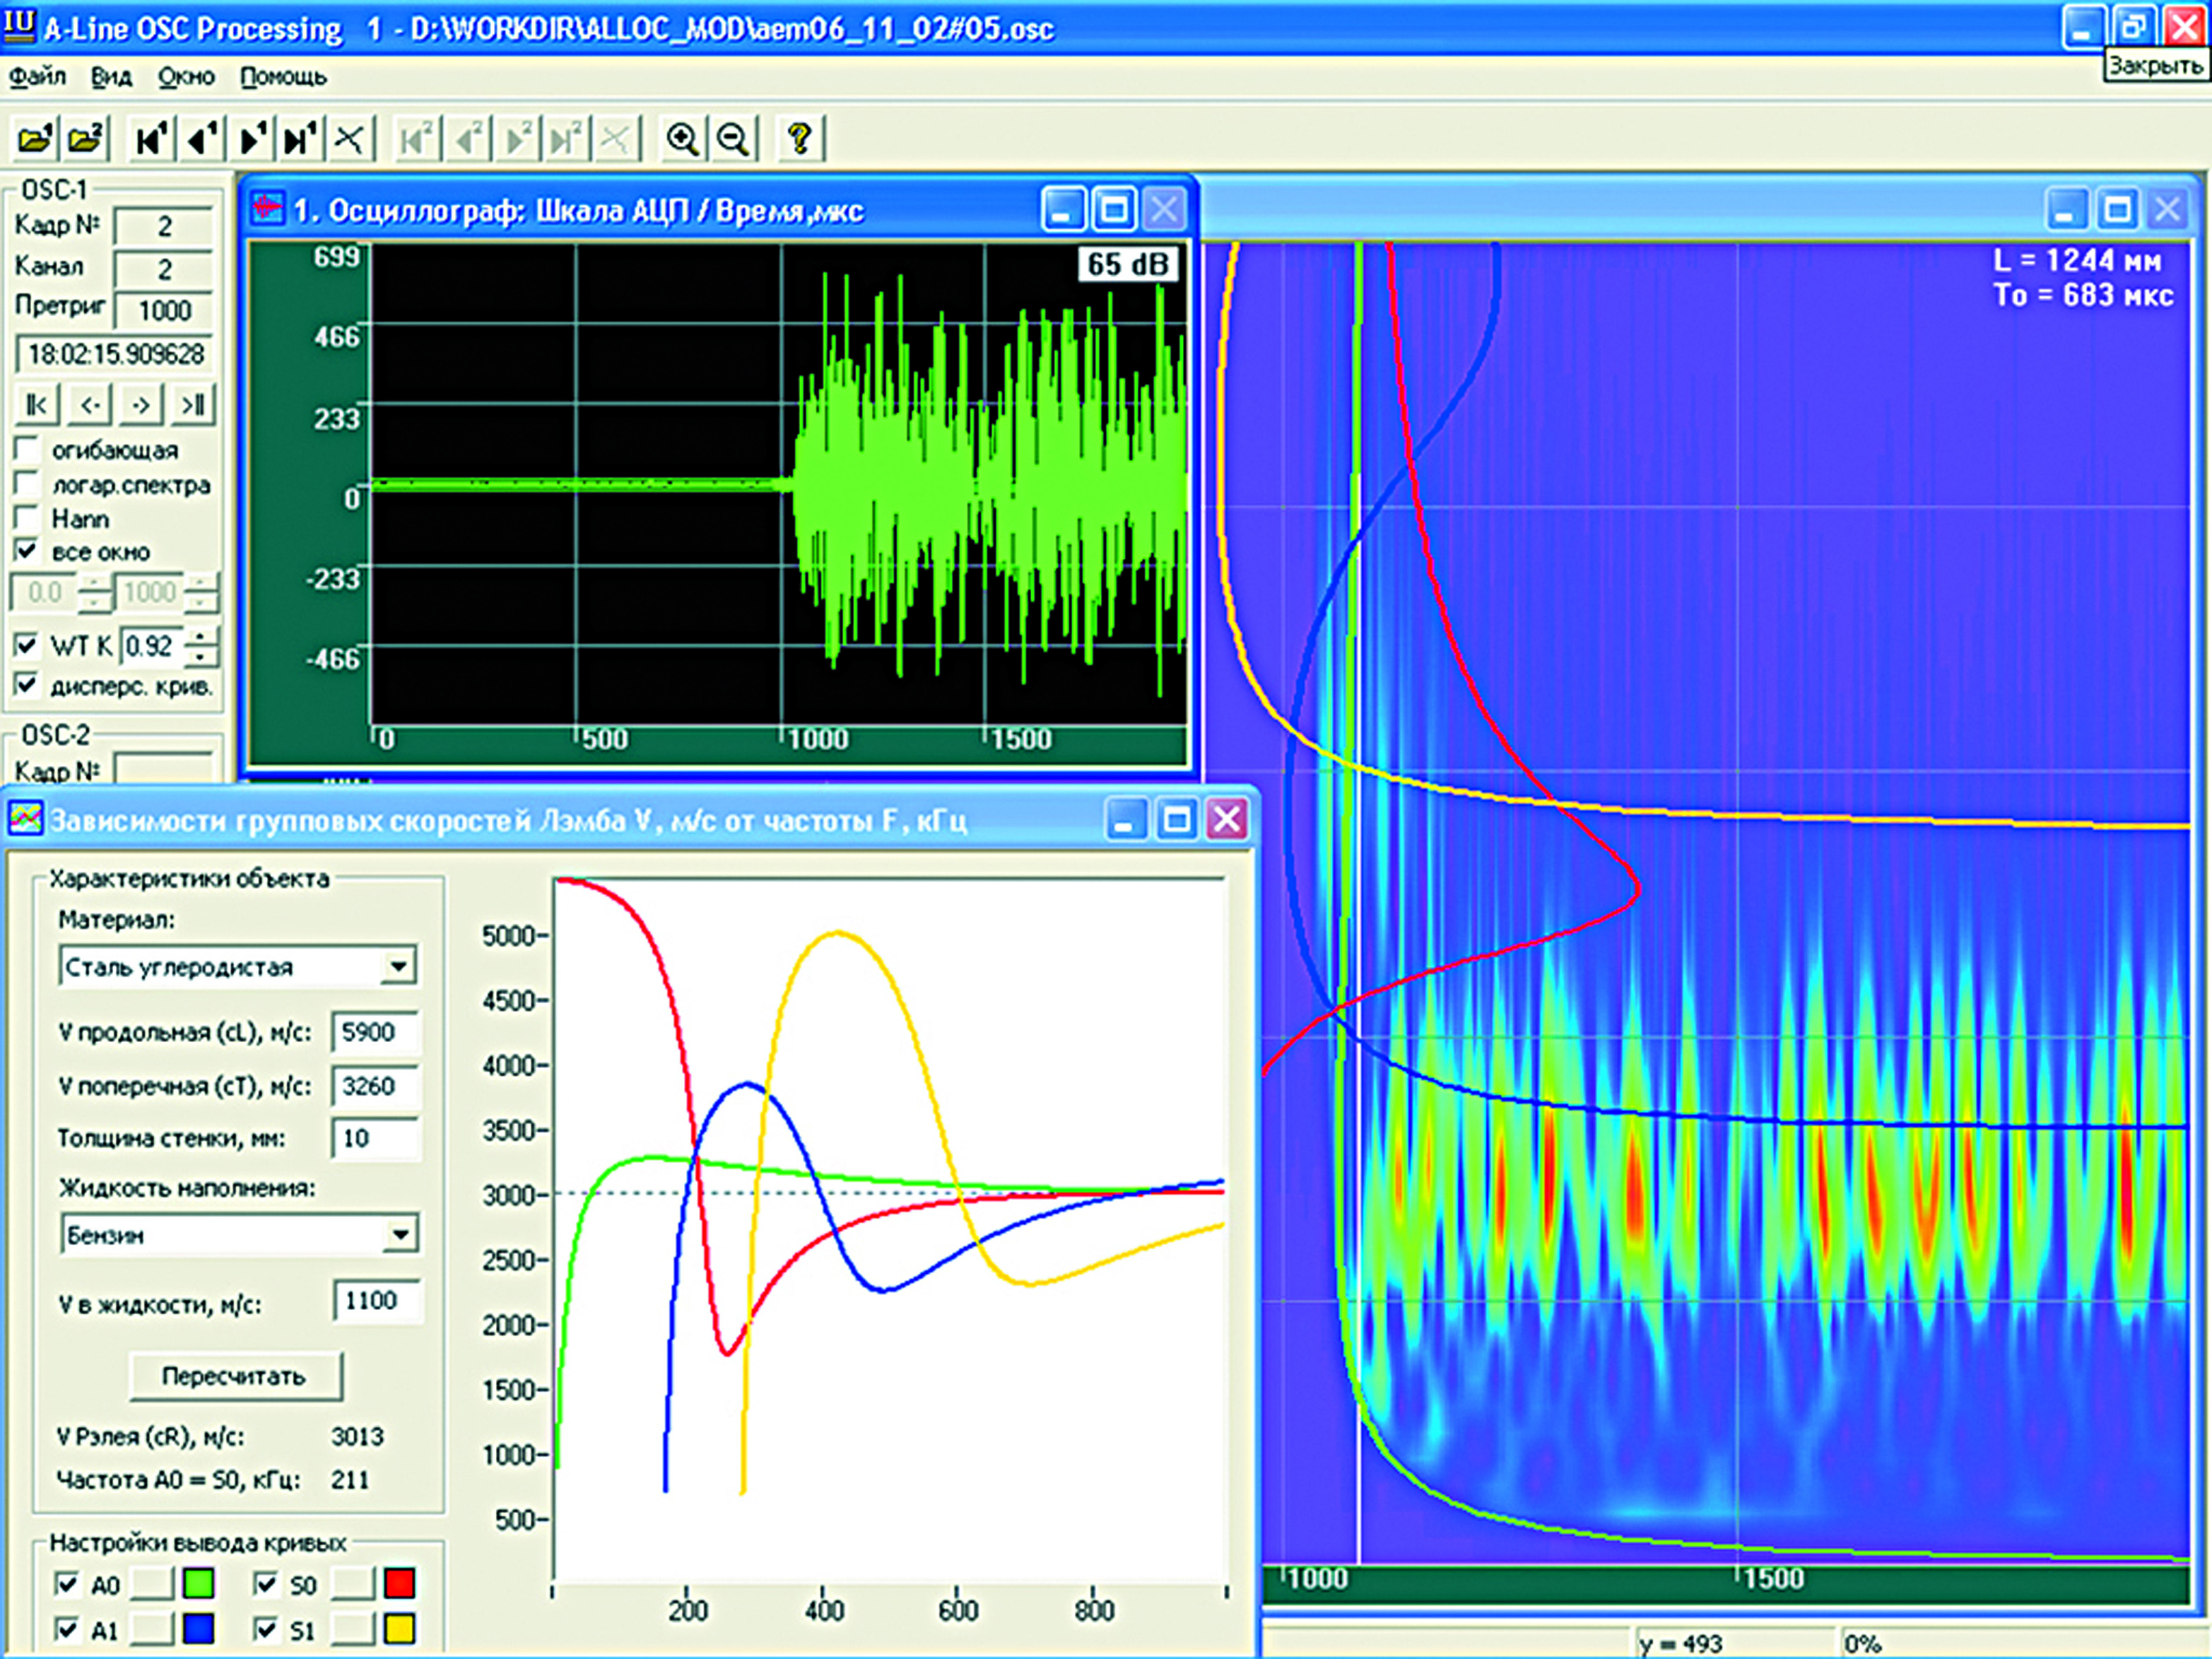
- Dispersive curves calculating in various environments together with the opportunity of its flexible imposing on the wavelet-spectrogram of the chosen AE impulse allows to define the type of the registered elastic wave and, at the same time, such important characteristics as the source occurrence depth and the distance to it.
- All the results of waveforms processing can be saved and exported to graphic or text format for simplification of their use at reporting, writing articles, etc.
- A-Line Stat
-
A-Line MON
Features of A-Line Mon software for thorough monitoring systems
- Trouble-free and reliable automatic registration, processing, analysis, display and long-term storage of a large number of sensor readings are the priority tasks of the software part of the monitoring systems which it perfectly fulfills.
- Detailed display of the object of monitoring diagram with the indicated measuring and control devices and the opportunity to operatively receive detailed data on the current state of each of its key elements is one of the advantages of the offered system of monitoring results display.
- Extended opportunities of hardware registration of sensor readings connected to parametric channels of the complex allow to deeply analyze the respective data including calculation of trends and fulfillment of the algorithms of regulation for feedback systems controls.
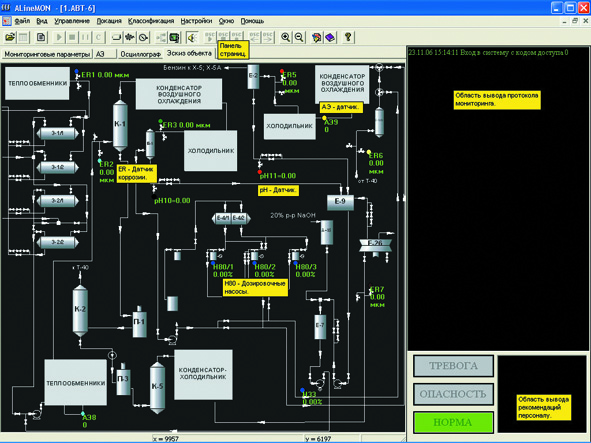
- Multilevel system of alarm and information messages alongside with the opportunity of significant events time and place details on the general layout, and in more detail on an individual model of the problem element makes the basis of the range of measures for the object of monitoring security assurance. In case of hazard the software automatically activates the warning system including sound and light alarms, specifies the site and type of the possible damage, gives staff operation recommendations, notifies the appropriate services and persons in charge via the available channels and assumes other measures stipulated for accident prevention. Besides, it is possible to connect specialized executive equipment, which at the command of the operator or automatically in alarm conditions, will receive the stipulated set of commands from the software with the purpose of exclusion of a possible failure.
- Multifactor thorough data analysis received from various type measuring units and a deep statistical processing of the database allow to objectively evaluate the current technical state of the object and to forecast development of the situation for the future on the basis of the physical concept of solid strength.
- Minimization of the human factor in estimation of the performance results is an important feature of the monitoring systems software.
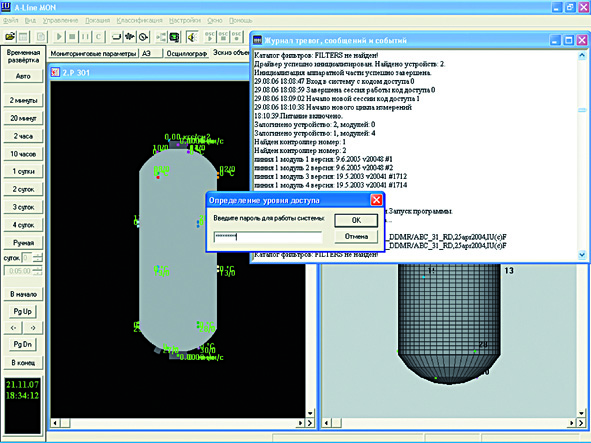
- Unauthorized data access protection and tamper resistance are implemented in compliance with the requirements imposed on automated systems of protection class 1G (Rus) set forth in relevant guidelines of Gostekhcomissiya: differentiation of access levels has been made, identification and check of authenticity of subjects’ access by code and password, registration of login attempts, startup (termination) of processes and issuing of commands, data requests, etc. are carried out.
- For convenience of the system maintenance the opportunity of automatic archiving and external data preservation are stipulated in the software as well as remote access to file archive for a certain group of the customer’s experts.
А-Line 32D software, developed for acoustic emission systems of various modifications and systems of CDM, is implemented in Windows environment, is based on general verified principles of hardware and dataflows command, is uniform in style regarding visual representation of graphic and text information and methods of set-up, is supplied with a detailed user's guide and is easily learnt.
Simple and convenient well known user-friendly interface in Russian fully realizes the ample opportunities of AE complexes and CDM systems on measurement, processing and representation of the results of testing both on-line and in the mode of the subsequent in-depth analysis the received data (postprocessing).
Interface
- The usual multiwindow and multipage interface for graphic and text representation of the data received in the course of data acquisition and in postprocessing is easily and independently set-up by the operator proceeding from peculiarities of a personal perception of information and the chosen methodical aspects of analysis.
- The convenient control menu for setting up the parameters of graphic and text display: forms of data output, color palette, automatic or fixed axes scaling, automatic scrolling of visibility scope, linear or logarithmic type of schedules and coordinate grid, increase mode, etc., satisfies any various users’ preferences regarding data representation.
- Compatibility of text and graphic data representation with other Windows applications makes data transfer to other information environments for carrying out of their individual extra analysis easy and accessible.
- Simplicity of set-up and control of the system alongside with ample opportunities of change of operation modes and characteristics of the complex is provided by application of modern elements of Windows control.
- At the client’s option the software interface can be translated into any language. English and Russian versions are currently available.
Perfomance capabilities
- All the data received in the course of the complex operation: AE data, readings of the sensors connected to parametric channels, characteristics of the condition and settings of the hardware component, the operator’s command and actions are automatically saved in specialized files of binary format, reading which it is possible not only to completely restore the testing resultant pattern, but also to repeat in detail all the process of data acquisition on a second-to-second basis. The received files can be divided into separate parts or vice versa to unite several parts in a unified whole as well as restore them in case of possible damage, for instance, as a result of power failure in the central block of data acquisition and processing.
- Settings of the hardware and software parts of the complex can be changed by the operator directly in the course of working as there is no need to stop of the process of measurements or restart the complex and can be saved in a separate file of configuration for convenience of further use. Thus, it is preferable to create in advance several various copies of settings, the so-called "instrumentation profiles", so as in the process of data acquisition to on-the-fly react to changes of the emission process character or other factors with the choice of the appropriate profile. Besides, to facilitate the subsequent data analysis, the operator can fix any events on-line which took place during the inspection by means of time markers supplied with text comments.
- Various locations of AE sources: linear and planar, zone and 3-dimentional (3D), on the surface of cylindrical, conic and spherical vessels, tank bottoms and walls allow to calculate the defects coordinates for object of any dimensions. Simultaneous formation and use of any number of various location groups is available, the same channel in various location groups can also be simultaneously used.
- A wide variety of classical methods of coordinates calculation implemented in software: AE arrival or maximum amplitude time difference, triangular (via three AE channels),
rectangular (via four AE channels) with adjustable velocity or arbitrary (via the whole set of AE impulses registered during a characteristic time interval), etc., provides ample opportunities of location analysis of the data acquired.
- Developed by the company employees, a new revolutionary method of the fuzzy location by freeform antenna, in turn has a number of essential advantages over classical procedures of location: it does not impose restrictions on sensors arrangement, is less sensitive to accuracy in impulse arrival time evaluation, accuracy of the assignment of AE impulses distribution velocity and anisotropy of the object material, etc.
- Graphic representation of the location results is implemented in the form of their overlay on maps and 3D models of the tested objects. Besides, to additionally illustrate the site of the revealed sources we overlay a graphic mask, representing a joints map or features of the composite construction of 2D or 3D object, on location windows.
- Application of flexible criteria of automatic rejection of false AE sources caused by electromagnetic noise, interference of different sort and re-reflections of signals, both in data acquisition mode and postprocessing considerably raises reliability of testing. Besides, use of “a parametrical strobe" is available, and namely, the opportunity to remove or keep only those events which in time coincided with the certain set value of the measured external parameter, for instance, the object load.
- Proceeding from the given model of waves attenuation in the object material, alongside with coordinates of AE sources, a location amplitudes map (impulse amplitudes at the radiation point) is calculated and displayed in a special window and is an important initial parameter for danger level evaluation of the revealed sources in terms of amplitude criterion and additional factor for the analysis of physical reliability of the results.
- According to the dynamics of accumulation of the located events, separately noted for each location group, conclusions are drawn on the current danger level of the revealed AE sources in terms of local dynamic criterion and decision making on expediency of the further object load in the course of testing.
- Location object clusterization (segmentation) can be carried out both on the number of located events and on the AE sources calculated amplitude which makes demonstrative the danger level in terms of concentration criterion and allows to evaluate the size of radiation region. The cluster location picture can be smoothed for elimination of casual and weak AE sources from the subsequent consideration.
- Alongside with classical methods of classification of AE sources by danger level executed according to PB 03-593-03: the amplitude, local dynamic and integrated ones, a new statistical criterion for differentiation of AE sources has been developed in our software in cooperation with the company experts. Its application, unlike other criteria, does not require preliminary data filtration.
- In the event that characteristics of acoustic waves distribution in the material of the tested object are unknown in advance, they can be evaluated using the built-in utility for AE impulses velocity and attenuation measurement in the environment.
- Ample opportunities for experimental data filtration: by any AE parameter and their combinations, by results of location and clusterization, by any highlightened graphic area on any diagram and functional formula connecting various characteristics of AE impulses as well as connecting them with external parameters, on removal of common-mode interference and leakage signals, etc. allow to apply the most complex methodical recommendations for useful signals extraction from the main stream of information. The applied sets of filters can be saved in separate specialized files and loaded for newly-received data analysis.
- Often we find it very useful to apply a special class of filters loaded before the commencement of measurements directly in the hardware of the complex, the so-called prefilters. In this case extraction of characteristic AE impulses occurs on-line in the computer part of the hardware and, hence, only an obviously useful signals are exposed to the program analysis and display, which considerably facilitates perception of the information and often allows to draw conclusions about the object state on-the-fly. That, alongside with the mode of automatically adjustable threshold, is a key moment for organization of a continuous monitoring and analysis in CDM systems.
- The use of audio alarm is an important element of diagnostics security and a means of additional indication of its certain stages and events. For this purpose, in the course of set up various probable events in the system, ranges of AE parameters registration, location coordinates, external parameters values, etc. are assigned to this or that wave file which is played at the moment of fulfillment of the specified conditions, attracting additional attention of the complex operators and the staff of the tested object.
- The software opportunities are best fulfilled in postprocessing. In this mode all the measured and calculated AE impulses parameters can be shown related to one another, to time, location coordinates and parametric channels data, as well as to histograms of distribution of signals number to AE parameters and emission flow properties. Plus quickview of characteristics of the impulses extracted in one window in text and oscillographic mode is available as well as their parallel extraction on other diagrams including location windows.
- The opportunity of copying any graphic and text information from the software to Windows clipboard with the subsequent insert into windows-documents of popular text and graphics editors, alongside with wide internal opportunities of printing charts in the type and color at the user’s option make the process of report generation by the AE testing results easy and convenient.
- Export of all kinds of data and contents of any graphic diagram to text format enables to use our clients’ own various algorithms for data processing in specialized software of statistical and mathematical analysis.
Features of A-Line OSC, the specialized software for acoustic emission wave forms processing
- The opportunity of convenient joint comparative analysis of two AE impulses wave forms registered by two different channels or one and the same channel, but at different time, is provided by a special pair window interface
- AE signals spectrum analysis based on fast Fourier transformation allows to make the analysis of frequency components of both a whole AE signal and its parts. It makes the program suitable not only for studying the emission nature in the course of the object testing, but also for laboratory research. Averaging of the chosen spectrum range is stipulated to ensure statistical reliability of the results.
- The presented correlation processing of AE signals waveforms and their spectra allowing to identify emission acts registered by different sensors from one source is an important element of the pattern recognition system.
- Statistical processing of both signals and set spectral frequency intervals enables carrying out of the statistical analysis under the set characteristics of the signals form and the spectrum frequency areas. Besides, calculation of partial power characteristics is available for each interval.
- Transformation of AE signals oscillograms into Windows sound files with various sampling rates gives the unique opportunity "to hear" emission.
- Calculation of wavelet-spectrograms of waveforms represents a powerful modern method of the time-and-frequency analysis of the AE data received.
- Dispersive curves calculating in various environments together with the opportunity of its flexible imposing on the wavelet-spectrogram of the chosen AE impulse allows to define the type of the registered elastic wave and, at the same time, such important characteristics as the source occurrence depth and the distance to it.
- All the results of waveforms processing can be saved and exported to graphic or text format for simplification of their use at reporting, writing articles, etc.
A-Line Stat - additional software for statistical analysis of AE data, designed for automatic clustering of acoustic emission data. A feature of this program is the ability to work, both with pulses of acoustic emission, and with oscillograms.

Features of A-Line Mon software for thorough monitoring systems
- Trouble-free and reliable automatic registration, processing, analysis, display and long-term storage of a large number of sensor readings are the priority tasks of the software part of the monitoring systems which it perfectly fulfills.
- Detailed display of the object of monitoring diagram with the indicated measuring and control devices and the opportunity to operatively receive detailed data on the current state of each of its key elements is one of the advantages of the offered system of monitoring results display.
- Extended opportunities of hardware registration of sensor readings connected to parametric channels of the complex allow to deeply analyze the respective data including calculation of trends and fulfillment of the algorithms of regulation for feedback systems controls.
- Multilevel system of alarm and information messages alongside with the opportunity of significant events time and place details on the general layout, and in more detail on an individual model of the problem element makes the basis of the range of measures for the object of monitoring security assurance. In case of hazard the software automatically activates the warning system including sound and light alarms, specifies the site and type of the possible damage, gives staff operation recommendations, notifies the appropriate services and persons in charge via the available channels and assumes other measures stipulated for accident prevention. Besides, it is possible to connect specialized executive equipment, which at the command of the operator or automatically in alarm conditions, will receive the stipulated set of commands from the software with the purpose of exclusion of a possible failure.
- Multifactor thorough data analysis received from various type measuring units and a deep statistical processing of the database allow to objectively evaluate the current technical state of the object and to forecast development of the situation for the future on the basis of the physical concept of solid strength.
- Minimization of the human factor in estimation of the performance results is an important feature of the monitoring systems software.
- Unauthorized data access protection and tamper resistance are implemented in compliance with the requirements imposed on automated systems of protection class 1G (Rus) set forth in relevant guidelines of Gostekhcomissiya: differentiation of access levels has been made, identification and check of authenticity of subjects’ access by code and password, registration of login attempts, startup (termination) of processes and issuing of commands, data requests, etc. are carried out.
- For convenience of the system maintenance the opportunity of automatic archiving and external data preservation are stipulated in the software as well as remote access to file archive for a certain group of the customer’s experts.